")
• Pre-processing refers to the transformations applied to our data before feeding it to the algorithm.
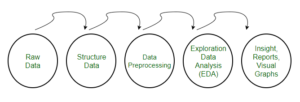
• Data Preprocessing is a technique that is used to convert the raw data into a clean data set. In other words, whenever the data is gathered from different sources it is collected in raw format which is not feasible for the analysis.
Need of Data Preprocessing
• For achieving better results from the applied model in Machine Learning projects the format of the data has to be in a proper manner. Some specified Machine Learning model needs information in a specified format, for example, Random Forest algorithm does not support null values, therefore to execute random forest algorithm null values have to be managed from the original raw data set.
• Another aspect is that data set should be formatted in such a way that more than one Machine Learning and Deep Learning algorithms are executed in one data set, and best out of them is chosen.
1. Rescale Data
• When our data is comprised of attributes with varying scales, many machine learning algorithms can benefit from rescaling the attributes to all have the same scale.
• This is useful for optimization algorithms in used in the core of machine learning algorithms like gradient descent.
• It is also useful for algorithms that weight inputs like regression and neural networks and algorithms that use distance measures like K-Nearest Neighbors.
• We can rescale your data using scikit-learn using the MinMaxScaler class.
# Python code to Rescale data (between 0 and 1)
import pandas
import scipy
import numpy
from sklearn.preprocessing import MinMaxScaler
url = "https://archive.ics.uci.edu/ml/machine-learning-databases/pima-indians-diabetes/pima-indians-diabetes.data"
names = ['age','preg', 'pres','plas', 'pedi', 'skin', 'mass', 'test', 'class']
dataframe = pandas.read_csv(url, names=names)
array = dataframe.values
# separate array into input and output components
X = array[:,0:8]
Y = array[:,8]
scaler = MinMaxScaler(feature_range=(0, 1))
rescaledX = scaler.fit_transform(X)
# summarize transformed data
numpy.set_printoptions(precision=3)
print(rescaledX[0:5,:])
After rescaling see that all of the values are in the range between 0 and 1.
Output
[[ 0.353 0.744 0.59 0.354 0.0 0.501 0.234 0.483]
[ 0.059 0.427 0.541 0.293 0.0 0.396 0.117 0.167]
[ 0.471 0.92 0.525 0. 0.0 0.347 0.254 0.183]
[ 0.059 0.447 0.541 0.232 0.111 0.419 0.038 0.0 ]
[ 0.0 0.688 0.328 0.354 0.199 0.642 0.944 0.2 ]]
2. Binarize Data (Make Binary)
• We can transform our data using a binary threshold. All values above the threshold are marked 1 and all equal to or below are marked as 0.
• This is called binarizing your data or threshold your data. It can be useful when you have probabilities that you want to make crisp values. It is also useful when feature engineering and you want to add new features that indicate something meaningful.
• We can create new binary attributes in Python using scikit-learn with the Binarizer class.
# Python code for binarization
from sklearn.preprocessing import Binarizer
import pandas
import numpy
url = "https://archive.ics.uci.edu/ml/machine-learning-databases/pima-indians-diabetes/pima-indians-diabetes.data"
names = ['preg', 'plas', 'pres', 'skin', 'test', 'mass', 'pedi', 'age', 'class']
dataframe = pandas.read_csv(url, names=names)
array = dataframe.values
# separate array into input and output components
X = array[:,0:8]
Y = array[:,8]
binarizer = Binarizer(threshold=0.0).fit(X)
binaryX = binarizer.transform(X)
# summarize transformed data
numpy.set_printoptions(precision=3)
print(binaryX[0:5,:])
We can see that all values equal or less than 0 are marked 0 and all of those above 0 are marked 1.
Output
[[ 1. 1. 1. 1. 0. 1. 1. 1.]
[ 1. 1. 1. 1. 0. 1. 1. 1.]
[ 1. 1. 1. 0. 0. 1. 1. 1.]
[ 1. 1. 1. 1. 1. 1. 1. 1.]
[ 0. 1. 1. 1. 1. 1. 1. 1.]]
3. Standardize Data
• Standardization is a useful technique to transform attributes with a Gaussian distribution and differing means and standard deviations to a standard Gaussian distribution with a mean of 0 and a standard deviation of 1.
• We can standardize data using scikit-learn with the StandardScaler class.
# Python code to Standardize data (0 mean, 1 stdev)
from sklearn.preprocessing import StandardScaler
import pandas
import numpy
url = "https://archive.ics.uci.edu/ml/machine-learning-databases/pima-indians-diabetes/pima-indians-diabetes.data"
names = ['preg', 'plas', 'pres', 'skin', 'test', 'mass', 'pedi', 'age', 'class']
dataframe = pandas.read_csv(url, names=names)
array = dataframe.values
# separate array into input and output components
X = array[:,0:8]
Y = array[:,8]
scaler = StandardScaler().fit(X)
rescaledX = scaler.transform(X)
# summarize transformed data
numpy.set_printoptions(precision=3)
print(rescaledX[0:5,:])
The values for each attribute now have a mean value of 0 and a standard deviation of 1.
Output
[[ 0.64 0.848 0.15 0.907 -0.693 0.204 0.468 1.426]
[-0.845 -1.123 -0.161 0.531 -0.693 -0.684 -0.365 -0.191]
[ 1.234 1.944 -0.264 -1.288 -0.693 -1.103 0.604 -0.106]
[-0.845 -0.998 -0.161 0.155 0.123 -0.494 -0.921 -1.042]
[-1.142 0.504 -1.505 0.907 0.766 1.41 5.485 -0.02 ]]