")
In data science one of the main concern is the time complexity which depends largely on the number of features. In the initial years the number of features was however not a concern. But today the amount of data and the features contributing information to them have increased exponentially. Hence it becomes necessary to find out convenient measures to reduce the number of features. Things that can be visualized can be comfortably taken a decision upon. Feature Mapping is one such of process of representing features along with relevancy of these features on a graph. This ensures that the features are visualized and their corresponding information is visually available. In this manner the irrelevant features are excluded and only the relevant ones are included.
This article, mainly focus on how the features can be graphically represented.
A graph G = {V, E, W} is a structure formed by a collection of points or vertices V, a set of pairs of points or edges E, each pair {u, v} being represented by a line and a weight W attached to each edge E. Each feature in a dataset is considered a node of an undirected graph. Some of these features are irrelevant and need to be processed to detect their relevancy in the learning, whether supervised or unsupervised. Various methods and threshold values determine the optimal feature set. In context of feature selection, a vertex can represent a feature, an edge can represent the relationship between two features and a weight attached to an edge can represent the strength of relationship between two features. Relation between two features is an area open for diverse approaches.
Pearson’s correlation coefficient determines the correlation between two features and hence how related they are. If two features contribute the same information then one among them is considered as potentially redundant, this is because the classification would finally give the same result whether or whether not both of them are included or any one of them is included.
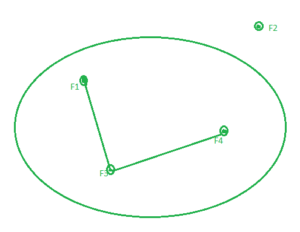
The correlation matrix of the features determines the association between various features. If two features are having an absolute value of correlation greater than 0.67 then the vertices representing those features are made adjacent by adding an edge and giving them weight equal to the correlation value. The features having association are the ones which are potentially redundant because they contribute same information. To eliminate the redundant features from these associated features, we use vertex cover algorithm to get the minimal vertex cover. The minimal vertex cover gives us the minimal set of optimal features which are enough to contribute the complete information which was previously contributed by all these associated features. This way we can reduce the number of features without compromising on the information content of the features.
Thus the optimal set of features are relevant with no redundancy and can contribute information as the original dataset. Reducing the number of features not only decreases the time complexity but also enhance the accuracy of the classification or clustering. This is because many times a few features in the dataset are completely redundant and divert the prediction.