Whenever we think of Machine Learning, the first thing that comes to our mind is a dataset. While there are many datasets that you can find on websites such as Kaggle, sometimes it is useful to extract data on your own and generate your own dataset. Generating your own dataset gives you more control over the data and allows you to train your machine learning model.
In this article, we will generate random datasets using the Numpy library in Python.
Libraries needed:
-> Numpy: pip3 install numpy
-> Pandas: pip3 install pandas
-> Matplotlib: pip3 install matplotlib
Normal distribution:
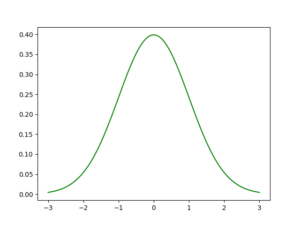
In probability theory, normal or Gaussian distribution is a very common continuous probability distribution that is symmetric about the mean, showing that data near the mean are more frequent in occurrence than data far from the mean. Normal distributions used in statistics and are often used to represent real-valued random variables.
The normal distribution is the most common type of distribution in statistical analyses. The standard normal distribution has two parameters: the mean and the standard deviation. The mean is the central tendency of the distribution. The standard deviation is a measure of variability. It defines the width of the normal distribution. The standard deviation determines how far away from the mean the values tend to fall. It represents the typical distance between the observations and the average. it fits many natural phenomena, For example, heights, blood pressure, measurement error, and IQ scores follow the normal distribution.

Graph of the normal distribution:
Example:
PYTHON3
# importing libraries
import pandas as pd
import numpy as np
import matplotlib.pyplot as plt
# initialize the parameters for the normal
# distribution, namely mean and std.
# deviation
# defining the mean
mu = 0.5
# defining the standard deviation
sigma = 0.1
# The random module uses the seed value as a base
# to generate a random number. If seed value is not
# present, it takes the system’s current time.
np.random.seed(0)
# define the x co-ordinates
X = np.random.normal(mu, sigma, (395, 1))
# define the y co-ordinates
Y = np.random.normal(mu * 2, sigma * 3, (395, 1))
# plot a graph
plt.scatter(X, Y, color = 'g')
plt.show()
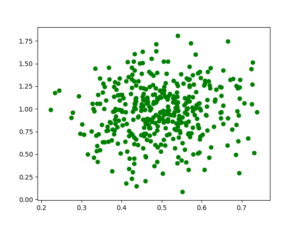
Output :

Let us look at a better example.
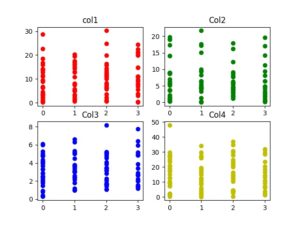
We will generate a dataset with 4 columns. Each column in the dataset represents a feature. The 5th column of the dataset is the output label. It varies between 0-3. This dataset can be used for training a classifier such as a logistic regression classifier, neural network classifier, Support vector machines, etc.
PYTHON3
# importing libraries
import numpy as np
import pandas as pd
import math
import random
import matplotlib.pyplot as plt
# defining the columns using normal distribution
# column 1
point1 = abs(np.random.normal(1, 12, 100))
# column 2
point2 = abs(np.random.normal(2, 8, 100))
# column 3
point3 = abs(np.random.normal(3, 2, 100))
# column 4
point4 = abs(np.random.normal(10, 15, 100))
# x contains the features of our dataset
# the points are concatenated horizontally
# using numpy to form a feature vector.
x = np.c_[point1, point2, point3, point4]
# the output labels vary from 0-3
y = [int(np.random.randint(0, 4)) for i in range(100)]
# defining a pandas data frame to save
# the data for later use
data = pd.DataFrame()
# defining the columns of the dataset
data['col1'] = point1
data['col2'] = point2
data['col3'] = point3
data['col4'] = point4
# plotting the various features (x)
# against the labels (y).
plt.subplot(2, 2, 1)
plt.title('col1')
plt.scatter(y, point1, color ='r', label ='col1')
plt.subplot(2, 2, 2)
plt.title('Col2')
plt.scatter(y, point2, color = 'g', label ='col2')
plt.subplot(2, 2, 3)
plt.title('Col3')
plt.scatter(y, point3, color ='b', label ='col3')
plt.subplot(2, 2, 4)
plt.title('Col4')
plt.scatter(y, point4, color ='y', label ='col4')
# saving the graph
plt.savefig('data_visualization.jpg')
# displaying the graph
plt.show()
Output :

