")
Problem Statement: Build a predictive Model for the shipping company, to find an estimate of how many Crew members a ship requires.
The dataset contains 159 instances with 9 features.
The Description of dataset is as below:
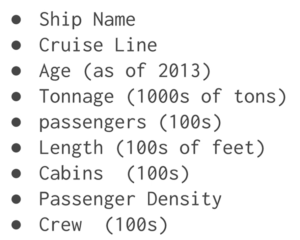
Let’s make the Linear Regression Model, predicting Crew members
Attached dataset: cruise_ship_info
import pyspark
from pyspark.sql import SparkSession
#SparkSession is now the entry point of Spark
#SparkSession can also be construed as gateway to spark libraries
#create instance of spark class
spark=SparkSession.builder.appName('housing_price_model').getOrCreate()
#create spark dataframe of input csv file
df=spark.read.csv('D:python codingpyspark_tutorialLinear regressioncruise_ship_info.csv'
,inferSchema=True,header=True)
df.show(10)
Output :
+-----------+-----------+---+------------------+----------+------+------+-----------------+----+
| Ship_name|Cruise_line|Age| Tonnage|passengers|length|cabins|passenger_density|crew|
+-----------+-----------+---+------------------+----------+------+------+-----------------+----+
| Journey| Azamara| 6|30.276999999999997| 6.94| 5.94| 3.55| 42.64|3.55|
| Quest| Azamara| 6|30.276999999999997| 6.94| 5.94| 3.55| 42.64|3.55|
|Celebration| Carnival| 26| 47.262| 14.86| 7.22| 7.43| 31.8| 6.7|
| Conquest| Carnival| 11| 110.0| 29.74| 9.53| 14.88| 36.99|19.1|
| Destiny| Carnival| 17| 101.353| 26.42| 8.92| 13.21| 38.36|10.0|
| Ecstasy| Carnival| 22| 70.367| 20.52| 8.55| 10.2| 34.29| 9.2|
| Elation| Carnival| 15| 70.367| 20.52| 8.55| 10.2| 34.29| 9.2|
| Fantasy| Carnival| 23| 70.367| 20.56| 8.55| 10.22| 34.23| 9.2|
|Fascination| Carnival| 19| 70.367| 20.52| 8.55| 10.2| 34.29| 9.2|
| Freedom| Carnival| 6|110.23899999999999| 37.0| 9.51| 14.87| 29.79|11.5|
+-----------+-----------+---+------------------+----------+------+------+-----------------+----+
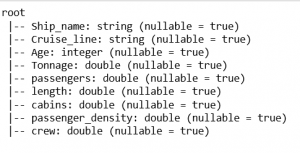
#prints structure of dataframe along with datatype
df.printSchema()
Output :
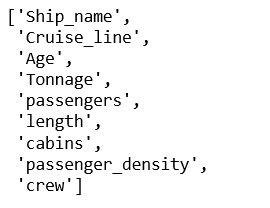
#In our predictive model, below are the columns
df.columns
Output :
#columns identified as features are as below:
#['Cruise_line','Age','Tonnage','passengers','length','cabins','passenger_density']
#to work on the features, spark MLlib expects every value to be in numeric form
#feature 'Cruise_line is string datatype
#using StringIndexer, string type will be typecast to numeric datatype
#import library strinindexer for typecasting
from pyspark.ml.feature import StringIndexer
indexer=StringIndexer(inputCol='Cruise_line',outputCol='cruise_cat')
indexed=indexer.fit(df).transform(df)
#above code will convert string to numeric feature and create a new dataframe
#new dataframe contains a new feature 'cruise_cat' and can be used further
#feature cruise_cat is now vectorized and can be used to fed to model
for item in indexed.head(5):
print(item)
print('n')
Output :
Row(Ship_name='Journey', Cruise_line='Azamara', Age=6,
Tonnage=30.276999999999997, passengers=6.94, length=5.94,
cabins=3.55, passenger_density=42.64, crew=3.55, cruise_cat=16.0)
Row(Ship_name='Quest', Cruise_line='Azamara', Age=6,
Tonnage=30.276999999999997, passengers=6.94, length=5.94,
cabins=3.55, passenger_density=42.64, crew=3.55, cruise_cat=16.0)
Row(Ship_name='Celebration', Cruise_line='Carnival', Age=26,
Tonnage=47.262, passengers=14.86, length=7.22,
cabins=7.43, passenger_density=31.8, crew=6.7, cruise_cat=1.0)
Row(Ship_name='Conquest', Cruise_line='Carnival', Age=11,
Tonnage=110.0, passengers=29.74, length=9.53,
cabins=14.88, passenger_density=36.99, crew=19.1, cruise_cat=1.0)
Row(Ship_name='Destiny', Cruise_line='Carnival', Age=17,
Tonnage=101.353, passengers=26.42, length=8.92,
cabins=13.21, passenger_density=38.36, crew=10.0, cruise_cat=1.0)
from pyspark.ml.linalg import Vectors
from pyspark.ml.feature import VectorAssembler
#creating vectors from features
#Apache MLlib takes input if vector form
assembler=VectorAssembler(inputCols=['Age',
'Tonnage',
'passengers',
'length',
'cabins',
'passenger_density',
'cruise_cat'],outputCol='features')
output=assembler.transform(indexed)
output.select('features','crew').show(5)
#output as below
Output :

#final data consist of features and label which is crew.
final_data=output.select('features','crew')
#splitting data into train and test
train_data,test_data=final_data.randomSplit([0.7,0.3])
train_data.describe().show()
Output :
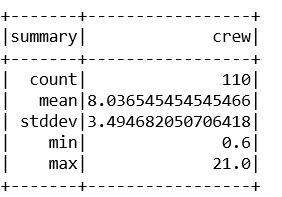
test_data.describe().show()
Output :

#import LinearRegression library
from pyspark.ml.regression import LinearRegression
#creating an object of class LinearRegression
#object takes features and label as input arguments
ship_lr=LinearRegression(featuresCol='features',labelCol='crew')
#pass train_data to train model
trained_ship_model=ship_lr.fit(train_data)
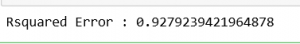
#evaluating model trained for Rsquared error
ship_results=trained_ship_model.evaluate(train_data)
print('Rsquared Error :',ship_results.r2)
#R2 value shows accuracy of model is 92%
#model accuracy is very good and can be use for predictive analysis
Output :
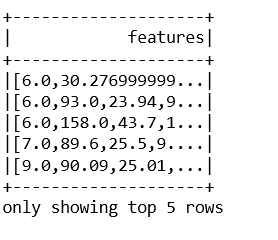
#testing Model on unlabeled data
#create unlabeled data from test_data
#testing model on unlabeled data
unlabeled_data=test_data.select('features')
unlabeled_data.show(5)
Output :
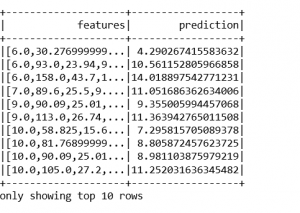
predictions=trained_ship_model.transform(unlabeled_data)
predictions.show()
#below are the results of output from test data
Output :