")
Linear Regression is a very common statistical method that allows us to learn a function or relationship from a given set of continuous data. For example, we are given some data points of x and corresponding y and we need to learn the relationship between them that is called a hypothesis.
In case of Linear regression, the hypothesis is a straight line, i.e,
h(x) = wx + b
Where w is a vector called Weights and b is a scalar called Bias. The Weights and Bias are called the parameters of the model.
All we need to do is estimate the value of w and b from the given set of data such that the resultant hypothesis produces the least cost J which is defined by the following cost function
J(w, b) = frac{1}{2m} sum_{i=1}^{m} (y_i - h(x_i)) ^ 2
where m is the number of data points in the given dataset. This cost function is also called Mean Squared Error.
For finding the optimized value of the parameters for which J is minimum, we will be using a commonly used optimizer algorithm called Gradient Descent. Following is the pseudo-code for Gradient Descent:
Repeat untill Convergence {
w = w - α * δJ/δw
b = b - α * δJ/δb
}
where α is a hyperparameter called the Learning Rate.
Tensorflow
Tensorflow is an open-source computation library made by Google. It is a popular choice for creating applications that require high-end numerical computations and/or need to utilize Graphics Processing Units for computation purposes. These are the main reasons due to which Tensorflow is one of the most popular choices for Machine Learning applications, especially Deep Learning. It also has APIs like Estimator which provide a high level of abstraction while building Machine Learning Applications. In this article, we will not be using any high-level APIs, rather we will be building the Linear Regression model using low-level Tensorflow in the Lazy Execution Mode during which Tensorflow creates a Directed Acyclic Graph or DAG which keeps track of all the computations, and then executes all the computations done inside a Tensorflow Session.
Implementation
We will start by importing the necessary libraries. We will use Numpy along with Tensorflow for computations and Matplotlib for plotting.
import numpy as np
import tensorflow as tf
import matplotlib.pyplot as plt
In order to make the random numbers predictable, we will define fixed seeds for both Numpy and Tensorflow.
np.random.seed(101)
tf.set_random_seed(101)
Now, let us generate some random data for training the Linear Regression Model.
# Genrating random linear data
# There will be 50 data points ranging from 0 to 50
x = np.linspace(0, 50, 50)
y = np.linspace(0, 50, 50)
# Adding noise to the random linear data
x += np.random.uniform(-4, 4, 50)
y += np.random.uniform(-4, 4, 50)
n = len(x) # Number of data points
Let us visualize the training data.
# Plot of Training Data
plt.scatter(x, y)
plt.xlabel('x')
plt.xlabel('y')
plt.title("Training Data")
plt.show()
Output:

Now we will start creating our model by defining the placeholders X and Y, so that we can feed our training examples X and Y into the optimizer during the training process.
X = tf.placeholder("float")
Y = tf.placeholder("float")
Now we will declare two trainable Tensorflow Variables for the Weights and Bias and initializing them randomly using np.random.randn().
W = tf.Variable(np.random.randn(), name = "W")
b = tf.Variable(np.random.randn(), name = "b")
Now we will define the hyperparameters of the model, the Learning Rate and the number of Epochs.
learning_rate = 0.01
training_epochs = 1000
Now, we will be building the Hypothesis, the Cost Function, and the Optimizer. We won’t be implementing the Gradient Descent Optimizer manually since it is built inside Tensorflow. After that, we will be initializing the Variables.
# Hypothesis
Y_prediction = tf.add(tf.multiply(X, W), b)
# Mean Squared Error Cost Function
cost = tf.reduce_sum(tf.pow(Y_prediction-Y, 2)) / (2 * n)
# Gradient Descent Optimizer
optimizer = tf.train.GradientDescentOptimizer(learning_rate).minimize(cost)
# Global Variables Initializer
init = tf.global_variables_initializer()
Now we will begin the training process inside a Tensorflow Session.
# Starting the Tensorflow Session
with tf.Session() as sess:
# Initializing the Variables
sess.run(init)
# Iterating through all the epochs
for epoch in range(training_epochs):
# Feeding each data point into the optimizer using Feed Dictionary
for (_x, _y) in zip(x, y):
sess.run(optimizer, feed_dict = {X : _x, Y : _y})
# Displaying the result after every 50 epochs
if (epoch + 1) % 50 == 0:
# Calculating the cost a every epoch
c = sess.run(cost, feed_dict = {X : x, Y : y})
print("Epoch", (epoch + 1), ": cost =", c, "W =", sess.run(W), "b =", sess.run(b))
# Storing necessary values to be used outside the Session
training_cost = sess.run(cost, feed_dict ={X: x, Y: y})
weight = sess.run(W)
bias = sess.run(b)
Output:
Epoch: 50 cost = 5.8868036 W = 0.9951241 b = 1.2381054
Epoch: 100 cost = 5.7912707 W = 0.99812365 b = 1.0914398
Epoch: 150 cost = 5.7119675 W = 1.0008028 b = 0.96044314
Epoch: 200 cost = 5.6459413 W = 1.0031956 b = 0.8434396
Epoch: 250 cost = 5.590799 W = 1.0053328 b = 0.7389357
Epoch: 300 cost = 5.544608 W = 1.007242 b = 0.6455922
Epoch: 350 cost = 5.5057883 W = 1.008947 b = 0.56222
Epoch: 400 cost = 5.473066 W = 1.01047 b = 0.48775345
Epoch: 450 cost = 5.4453845 W = 1.0118302 b = 0.42124167
Epoch: 500 cost = 5.421903 W = 1.0130452 b = 0.36183488
Epoch: 550 cost = 5.4019217 W = 1.0141305 b = 0.30877414
Epoch: 600 cost = 5.3848577 W = 1.0150996 b = 0.26138115
Epoch: 650 cost = 5.370246 W = 1.0159653 b = 0.21905091
Epoch: 700 cost = 5.3576994 W = 1.0167387 b = 0.18124212
Epoch: 750 cost = 5.3468933 W = 1.0174294 b = 0.14747244
Epoch: 800 cost = 5.3375573 W = 1.0180461 b = 0.11730931
Epoch: 850 cost = 5.3294764 W = 1.0185971 b = 0.090368524
Epoch: 900 cost = 5.322459 W = 1.0190892 b = 0.0663058
Epoch: 950 cost = 5.3163586 W = 1.0195289 b = 0.044813324
Epoch: 1000 cost = 5.3110332 W = 1.0199214 b = 0.02561663
Now let us look at the result.
# Calculating the predictions
predictions = weight * x + bias
print("Training cost =", training_cost, "Weight =", weight, "bias =", bias, 'n')
Output:
Training cost = 5.3110332 Weight = 1.0199214 bias = 0.02561663
Note that in this case both the Weight and bias are scalars. This is because, we have considered only one dependent variable in out training data. If we have m dependent variables in our training dataset, the Weight will be an m-dimensional vector while bias will be a scalar.
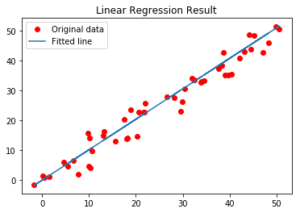
Finally, we will plot our result.
# Plotting the Results
plt.plot(x, y, 'ro', label ='Original data')
plt.plot(x, predictions, label ='Fitted line')
plt.title('Linear Regression Result')
plt.legend()
plt.show()
Output: