")
Principal Component Analysis (PCA) is a statistical procedure that uses an orthogonal transformation which converts a set of correlated variables to a set of uncorrelated variables. PCA is a most widely used tool in exploratory data analysis and in machine learning for predictive models. Moreover, PCA is an unsupervised statistical technique used to examine the interrelations among a set of variables. It is also known as a general factor analysis where regression determines a line of best fit.
Module Needed:
import pandas as pd
import numpy as np
import matplotlib.pyplot as plt
import seaborn as sns
%matplotlib inline
Code #1:
# Here we are using inbuilt dataset of scikit learn
from sklearn.datasets import load_breast_cancer
# instantiating
cancer = load_breast_cancer()
# creating dataframe
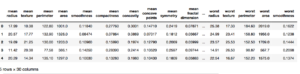
df = pd.DataFrame(cancer['data'], columns = cancer['feature_names'])
# checking head of dataframe
df.head()
Output:
Code #2:
# Importing standardscalar module
from sklearn.preprocessing import StandardScaler
scalar = StandardScaler()
# fitting
scalar.fit(df)
scaled_data = scalar.transform(df)
# Importing PCA
from sklearn.decomposition import PCA
# Let's say, components = 2
pca = PCA(n_components = 2)
pca.fit(scaled_data)
x_pca = pca.transform(scaled_data)
x_pca.shape
Output:
# Reduced to 569, 2
(569,2)
# giving a larger plot
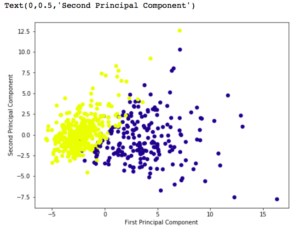
plt.figure(figsize =(8, 6))
plt.scatter(x_pca[:, 0], x_pca[:, 1], c = cancer['target'], cmap ='plasma')
# labeling x and y axes
plt.xlabel('First Principal Component')
plt.ylabel('Second Principal Component')
Output:
# components
pca.components_
Output:

df_comp = pd.DataFrame(pca.components_, columns = cancer['feature_names'])
plt.figure(figsize =(14, 6))
# plotting heatmap
sns.heatmap(df_comp)
Output:
